
Application: Microsoft Office 2007 Word, Excel, PowerPoint; Microsoft Office 2010 Word, Excel, PowerPoint
When working with Office files, it is important to know the location of the saved document. Files can be saved on a local computer, a storage device, a shared drive, or SharePoint. Microsoft Office has a Document Location command that can be added to the Quick Access Toolbar so that the save location is always visible.
How to add the Document Location command in Office 2007
1. In Word, Excel, or PowerPoint, go to the Office button.
2. Click on Word Options, Excel Options or PowerPoint Options.
3. Select Customize.
4. In the drop down box Choose Commands from, select All Commands.
5. Scroll down to find Document Location, then click Add.
6. Click OK.
How to add the Document Location command in Office 2010
1. In Word, Excel, or PowerPoint go to the File tab.
2. Go to Options.
3. Select Quick Access Toolbar.
4. In the drop down box Choose Commands from, select All Commands.
5. Scroll down to find Document Location, then click Add.
6. Click OK.
Monday, January 24, 2011


Monday, December 13, 2010
Tip of the Week: Digital Photo Frames for Presenting Information
Digital photo frames are a unique way to present materials in the classroom or office setting. By creating a PowerPoint slideshow, information including both text and images can be presented using a digital photo frame.
Preparing the PowerPoint file After creating a PowerPoint slideshow, save the file in jpeg format. This prepares the slideshow to be viewed as images. Depending on the photo frame options, the slideshow can be loaded via thumb drive, email, or from various websites such as Picasa, Facebook, Flickr or others.
Frame Options Some frames allow portrait and landscape modes, music, picture and video modes, touch-screen options, web browsing, clock and calendar features. Others offer remote controls, which may be useful for classroom settings or conference presentation settings.
A digital photo frame may be used as a substitute for a PC or laptop in certain settings, including small table top displays, or spaces with limited electrical outlets.
Preparing the PowerPoint file After creating a PowerPoint slideshow, save the file in jpeg format. This prepares the slideshow to be viewed as images. Depending on the photo frame options, the slideshow can be loaded via thumb drive, email, or from various websites such as Picasa, Facebook, Flickr or others.
Frame Options Some frames allow portrait and landscape modes, music, picture and video modes, touch-screen options, web browsing, clock and calendar features. Others offer remote controls, which may be useful for classroom settings or conference presentation settings.
A digital photo frame may be used as a substitute for a PC or laptop in certain settings, including small table top displays, or spaces with limited electrical outlets.
Monday, December 6, 2010
Tip of the Week: Collaboration
Web 2.0 Tools Bounce and LiveBinders
Collaborating with others takes on a whole new dimension using web pages. What’s a good way to keep track of all those pages and articles? Which part of the web page is important? Which web page is for which project? How can web pages be shared with others-and include comments or thoughts? Several Web 2.0 tools are available!
What are the differences?
• Bounce is an app that takes a screenshot of a website. The image can be named, portions highlighted, and notes added. The image and the additions can be shared through Facebook, Twitter, or the URL of the saved image can be emailed.
• LiveBinders is a way to keep bookmarks in a “binder” similar to a notebook. A binder can be created for each project or grouping of bookmarks. Also, documents can be uploaded to the binder to keep project notes and resources in one place. Binders can be categorized and shared with others via email. Each binder has its own URL to make searching easier. Each binder also has a “present” option so that the information can be presented directly from the site.
Collaborating with others takes on a whole new dimension using web pages. What’s a good way to keep track of all those pages and articles? Which part of the web page is important? Which web page is for which project? How can web pages be shared with others-and include comments or thoughts? Several Web 2.0 tools are available!
What are the differences?
• Bounce is an app that takes a screenshot of a website. The image can be named, portions highlighted, and notes added. The image and the additions can be shared through Facebook, Twitter, or the URL of the saved image can be emailed.
• LiveBinders is a way to keep bookmarks in a “binder” similar to a notebook. A binder can be created for each project or grouping of bookmarks. Also, documents can be uploaded to the binder to keep project notes and resources in one place. Binders can be categorized and shared with others via email. Each binder has its own URL to make searching easier. Each binder also has a “present” option so that the information can be presented directly from the site.
Monday, November 29, 2010
Tip of the Week: Excel Charts
Charts display numbers in a picture form. Creating a chart in Excel starts by entering the data on a worksheet. The data can be arranged in rows or columns. Excel can automatically determine the best way to plot the data in the chart. A chart can also be built manually.
To create a chart automatically:
After entering the data on a worksheet, highlight the data to be charted. Pre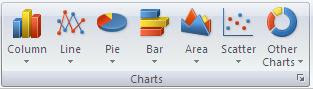 ss F11. A chart appears.
To create a chart manually:
After data is entered, click on the Insert ribbon and look for the Chart tab. Choose the chart type and sub-type to plot the data.
To modify a chart: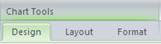
Clicking anywhere in a chart makes the Chart Tools available, adding the Design, Layout, and Format tabs. Within each of these tabs contains options to modify and format the plot area, data points, horizontal and vertical axis, legend, chart and axis title, as well as data labels.
To create a chart automatically:
After entering the data on a worksheet, highlight the data to be charted. Pre
 ss F11. A chart appears.
To create a chart manually:
After data is entered, click on the Insert ribbon and look for the Chart tab. Choose the chart type and sub-type to plot the data.
To modify a chart:

Clicking anywhere in a chart makes the Chart Tools available, adding the Design, Layout, and Format tabs. Within each of these tabs contains options to modify and format the plot area, data points, horizontal and vertical axis, legend, chart and axis title, as well as data labels.
Monday, November 15, 2010
Tip of the Week: Sharing Documents in SharePoint
Application: SharePoint
Documents can be shared through SharePoint so that multiple people can have access and share editing responsibilities. SharePoint also offers the option to keep track of versions so that changes can be tracked.
Using SharePoint check out/in for documents
• Only one person can edit a document at a time
• Useful for groups of people working on the same document
• When the document is checked out, others can open a read-only copy
Using SharePoint versioning for documents
• Tracks changes on documents
• Previous versions can be viewed or restored as a part of the current version
• Versions can be tracked with the name of each person that has checked out/in the document and comments about changes.
Documents can be shared through SharePoint so that multiple people can have access and share editing responsibilities. SharePoint also offers the option to keep track of versions so that changes can be tracked.
Using SharePoint check out/in for documents
• Only one person can edit a document at a time
• Useful for groups of people working on the same document
• When the document is checked out, others can open a read-only copy
Using SharePoint versioning for documents
• Tracks changes on documents
• Previous versions can be viewed or restored as a part of the current version
• Versions can be tracked with the name of each person that has checked out/in the document and comments about changes.
Monday, November 8, 2010
Tip of the Week: Illustrations
Application: Microsoft Word , Excel, PowerPoint, Outlook
Illustrations add color, shape, and emphasis to your text and data. Microsoft Office offers multiple ways to include visual elements in a document.
• SmartArt include list, process, cycle, hierarchy, relationship, matrix, pyramid, and picture options.
• Shapes include lines, basic shapes, rectangles, block arrows, equation shapes, flowchart, stars and banners, and callout options.
• Clip Art is a gallery of images organized by theme.
• Pictures can be used as well.
• A variety of charts and graphs are available to insert to better display data.
All of these images can be modified in appearance with shape size, color, and text formatting.
Using Illustrations1. In any program, (Word, Excel, PowerPoint, Outlook E-Mail message) click the Insert tab.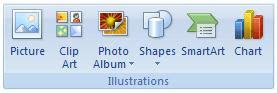
2. Select the item to insert (Picture, Clip Art, Shapes, SmartArt, Chart, Photo Album-PowerPoint).
3. Select specific item. Depending on selection, other options will become available such as entering text or formatting choices.
Illustrations add color, shape, and emphasis to your text and data. Microsoft Office offers multiple ways to include visual elements in a document.
• SmartArt include list, process, cycle, hierarchy, relationship, matrix, pyramid, and picture options.
• Shapes include lines, basic shapes, rectangles, block arrows, equation shapes, flowchart, stars and banners, and callout options.
• Clip Art is a gallery of images organized by theme.
• Pictures can be used as well.
• A variety of charts and graphs are available to insert to better display data.
All of these images can be modified in appearance with shape size, color, and text formatting.
Using Illustrations1. In any program, (Word, Excel, PowerPoint, Outlook E-Mail message) click the Insert tab.

2. Select the item to insert (Picture, Clip Art, Shapes, SmartArt, Chart, Photo Album-PowerPoint).
3. Select specific item. Depending on selection, other options will become available such as entering text or formatting choices.
Monday, November 1, 2010
Tip of the Week: SharePont Surveys
Application: SharePoint
Surveys are a method of gathering information from individuals in a standardized way. Surveys can be used to gather feedback, evaluate, or to determine trends in a group. SharePoint offers a survey tool for TWU faculty, staff and students.
What does a SharePoint survey offer?• Branching logic: depending on how a respondent answers, certain questions may or may not appear
• Many question types:
o Multiple choice
o Multiple answers
o Open response
o Rating/Likert scale
• Option to export data to Microsoft Excel
• Restrict number of responses per respondent
• User must be logged in to Sharepoint (with portal login), so data is collected only from TWU population.
Surveys are a method of gathering information from individuals in a standardized way. Surveys can be used to gather feedback, evaluate, or to determine trends in a group. SharePoint offers a survey tool for TWU faculty, staff and students.
What does a SharePoint survey offer?• Branching logic: depending on how a respondent answers, certain questions may or may not appear
• Many question types:
o Multiple choice
o Multiple answers
o Open response
o Rating/Likert scale
• Option to export data to Microsoft Excel
• Restrict number of responses per respondent
• User must be logged in to Sharepoint (with portal login), so data is collected only from TWU population.


 Posts
Posts

